| Viking Lander 2 meteorological data |
 |
| Viking Lander 2 meteorological data |
|
In July 1976 two Viking Landers set down on the Martian surface and besides analyzing the soil and searching for biological activity these Landers recorded the Martian weather till November 1982.
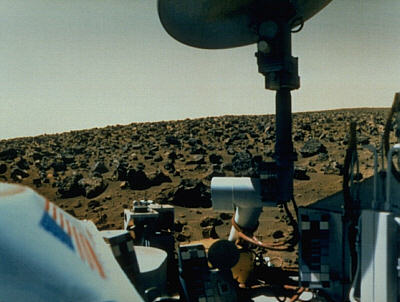
We will now read in data sent back to Earth from Viking Lander 2 and display the temperature and wind speed recorded between Sols 51 to 53 - i.e. taken during the 51th to 53th Martian day after landing (July 04, 1976) - in one plot in Maple V Release 3, 4, and 5, Maple 6 and 7.
> restart:In order to display different data in one plot the wind speed data needs to be adjusted to the range of the temperature. Function mean computes the mean of the data given, function adapt returns a sequence of lists with the data aligned. Arguments to adapt are:
> mean := proc(l::listlist)
>    local vals;
>    vals := op(map(x -> op(2, x), l));
>    (min(vals)+max(vals))/2
> end:

> adapt := proc(l::listlist, scale::numeric, f::numeric)
>    # for R3, R4, and R5
>    local n, result:
>    result := NULL:
>    for n to nops(l) do
>       result := result, [ l[n][1], l[n][2]*scale - f ]
>    od;
>    result
> end:

> adapt := proc(l::listlist, scale::numeric, f::numeric)
>    # for R5 only
>    op(map(x -> [op(1, x), op(2, x) * scale - f], l))
> end:
The original file segment1.html contains the following meteorological data:
C           Solar               Wind   Wind  Pressure  Temperature
C           Longitude           Speed  Dir
C   Year    L_s (deg.) Sol      m/sec  deg.     mb      F.      C.
C
C

         1  142.767   51.02     2.0      41    7.38  -105.23  -76.24
         1  142.788   51.06     3.1      48    7.38  -109.79  -78.77
         1  142.809   51.10     3.4      53    7.38  -113.53  -80.85
         1  142.829   51.14     3.2      77    7.38  -117.35  -82.97
File location: http://www-k12.atmos.washington.edu/k12/mars/data/vl2/segment1.html.
Comments are denoted by the character `C` at the beginning of each line, so they can be easily be skipped using substring.
> filein := `e:/segment1.htm`:

> data := NULL:

> alt := readline(filein):

> tbl := table([]):

> i := 0:

> while alt <> 0 do
>    if not(member(substring(convert(alt, name), 1 .. 1),
>       {`C`, `<`})) then
>       i := i + 1:
>       tbl[i] := sscanf(alt, `%*f %*f %f %f %d %f %*f %f`)
>    fi:
>    alt := readline(filein):
> od:

> data := [seq(tbl[j], j=1 .. i)]: i := 'i': j := 'j':
Now read in both the temperatures and wind speeds and create plots to be displayed with
plots/display later.
> temp := map(x -> [op(1, x), op(5, x)], data):

> p1 :=
>    plot(temp, sol=95 .. 97, `deg C`=-90 .. -10, axes=frame):

> wind := map(x -> [op(1, x), op(2, x)], data):

> p2 :=
>    plot([adapt(wind, -mean(temp)/mean(wind), -1.9*mean(temp) )],
>    sol=95 .. 97, axes=frame, color=navy, linestyle=3):

> plots[display](p1, p2, labels=[`sol`, `deg C`],
>    title=`Viking Lander 2 meteorological data Sol 95 through 97`);
The red curve represents the temperature in degrees Celsius, the dotted, blue line the wind speed in meters per second.
The following archives contain the files for creating the charts in R3, R4, R5, Maple 6 and
Maple 7 along with the original data contributed by Prof. James E. Tillman ![]() :
:
MAPLE UNIVERSE VL2 1.3 current as of December 25, 2001
Author: Alexander F. Walz, alexander.f.walz@t-online.de
Original file location: http://www.math.utsa.edu/mirrors/maple/mpluniv3.htm