
The math package primarily is a supplement to the student package shipped with Maple V and features a lot of functions which are not included in the latter package.
> restart: libname := `c:/maplev4/math`, libname:

> with(math);
[END, Makehelp, PSconv, V, Write, WriteLn, _Zval, addlib, addtbl,
> fsolve(sin(x), x=-10 .. 10);
> fnull(sin(x), x=-10 .. 10);
(However, you may set the global variable _EnvAllSolutions := true so that solve returns general solution(s).)
> extrema(x^5-x^3, x=-10 .. 10);
> extrema(x^5-x^3, x=-10 .. 10, floats);
> extrema(x^2, x=-10 .. 10, max); # no result

> extrema(x^2, x=-10 .. 10, min);
> extrema(x^3, x=-10 .. 10); # no result

> inflection(x^3, x=-10 .. 10);
> inflection(x^2*sin(x), x=-10 .. 10, eps=1e-5);
> cont((x^2-3*x+2)/(x^2+2*x-3), x=1);

> readlib(discont)(sqrt(x), x);
> singularity(sqrt(x), x);
> singularity(tan(x), x);
> pole(1/x, x);
> removable(sin(x)/x, x);
> jump(floor(x), x);
> cartprod([[1, 2, 3, 4], [x, y, z]], 'p');
> p;
> f := x -> (1/2*x^3-3/2*x+1)/(x^2+3*x+2);

First let us determine the oblique asymptote with function math/asym:
> asym(f(x));
Use un for an abbreviated version of unapply:
> a := un(");
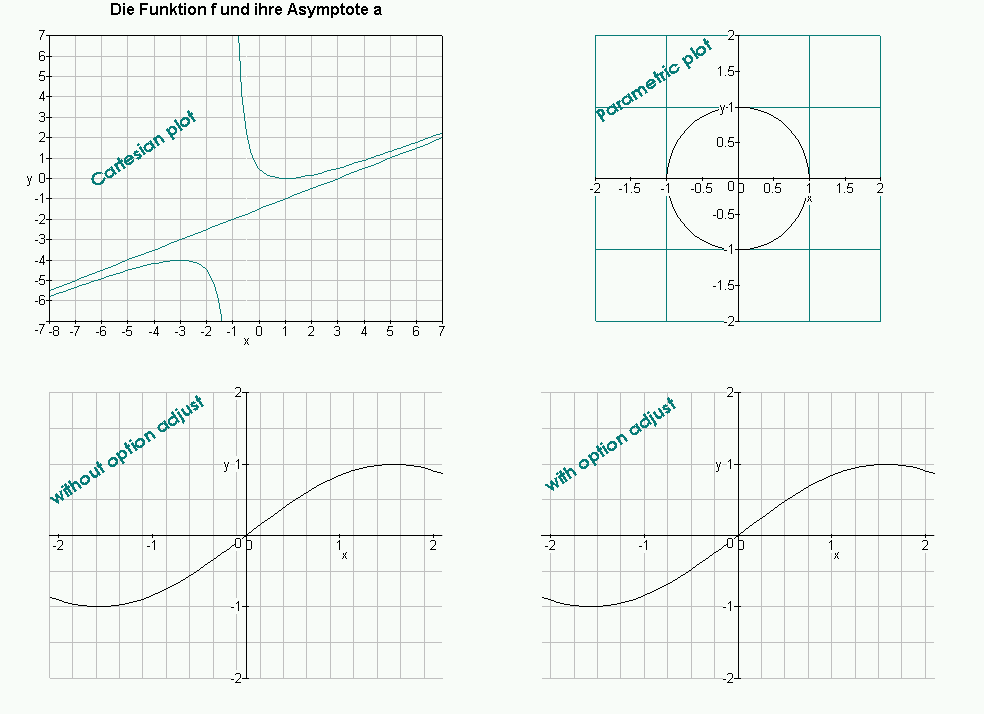
Besides accepting all valid plotoptions, gridplot has two additional options:
> gridplot({f(x), a(x)}, x=-8 .. 7, y=-7 .. 7,
>    discont=true,
>    axes=box,
>    labels=[`x`, `y`],
>    units=1,
>    color=darkcyan,
>    axesfont=[HELVETICA, 10],
>    titlefont=[HELVETICA, BOLD, 12],
>    title=`Die Funktion f und ihre Asymptote a`);
You may also pass parametric functions to gridplot. math includes a new color 'darkcyan'. See ?math, init for more colors.
> gridplot([sin(t), cos(t), t=-Pi .. Pi], x=-2 .. 2, y=-2 .. 2,
>    gridcolor=darkcyan,
>    units=0.5,
>    scaling=constrained);
You specify the adjust option to move the grid left or right and up or down.
> gridplot(sin(x), x=-2.1 .. 2.1, y=-2 .. 2,
>    units=1, step=[0.25, 0.5]);

> gridplot(sin(x), x=-2.1 .. 2.1, y=-2 .. 2,
>    units=1, step=[0.25, 0.5], adjust=[0.1, 0]);

> symmetry(x^2);
> symmetry(x^3-x);
> symmetry(exp(x));
> s := Sum((-1)^(n+1)*(x-1)^n/n, n=1 .. infinity);

> PSconv(s);
> PSconv(s, limit);

> PSconv(s, range);
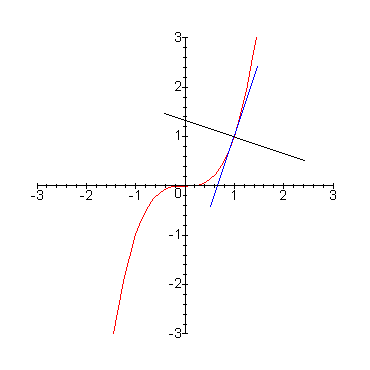
> f := x -> x^3:Determine the tangent and normal lines at the point x=1:
> tangente(f(x), x=1);
> normale(f(x), x=1);
> curveplot(f(x), x=1, [normalline, tangentline],
>    x=-3 .. 3, y=-3 .. 3, tangentcolor=blue, scaling=constrained,
>    length=3, normalcolor=black);

> assume(r, positive):

> 4*arclen(sqrt(r^2-x^2), x=0 .. r);
> arclen([t, t^2, 2/3*t^3], t=0 .. 3);
> mean(sin(x), x=0 .. Pi, linear);
> mean(sin(x), x=0 .. Pi, quadratic);
> curvature(sin(x+t), x);

> slopefn(x^2, x=t);
> lineangle([2*x-3, 1/2*x+1]);
> convert([1/2*t^2+2, 3/4*t^2+1], explicit);
> assume(r, positive):

> rotation(sqrt(r^2-x^2), x=0 .. r, area, xaxis);
> rotation(sqrt(x), x=0 .. 4, area, yaxis);
> rotation(x^2, x=0 .. sqrt(2), vol, yaxis);
> rotation(x*exp(-x), x=0 .. 1, vol, xaxis, float);
> rotation(sqrt(4-x), x=0 .. 4, xaxis, center);
> rotation((4-x)*sqrt(2*x), x=0 .. 4, xaxis, moment, float);
> f := x -> sqrt(x^3+4*x^2+4*x);
> domain(f(x));
> isCont(abs(x), x=0);
> isDiff(abs(x), x=0);
> nondiff(arcsin(2*abs(x)*sqrt(1-x^2)), x);
> extrema(abs(x), x);
> END(abs(x), x);
Author: Alexander F. Walz, alexander.f.walz@t-online.de
Original file location: http://www.math.utsa.edu/mirrors/maple/mplmana.htm