

This is a variation of the procedure Alex' Error by plotting the trajectory a point traverses through iteration of the formula
Files for download:
> restart:

> orbits := proc(x, y, iter)
>    local c, z, pts;
>    pts := NULL;
>    c := evalf(x+y*I);
>    z := c;
>    to iter do
>       if abs(z) < 1e10 then
>          pts := pts, [Re(z), Im(z)]
>       fi;
>       z := z^2+c
>    od;
>    [pts]
> end:

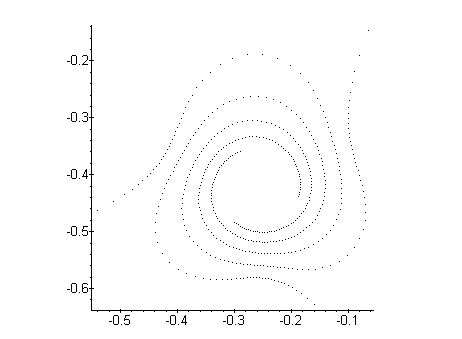
> plot(orbits(-0.14222874119878, -0.64732701703906, 500), style=point,
>    symbol=POINT, axes=framed, scaling=constrained);
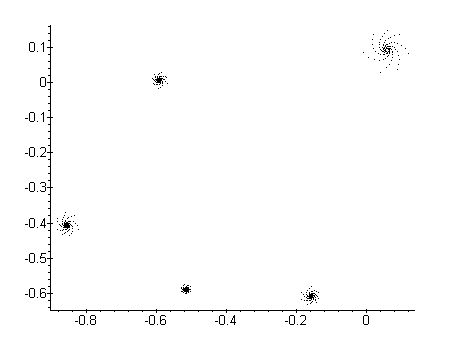
> plot(orbits(-0.50977517291904, -0.60039090737700, 500), style=point,
>    symbol=POINT, axes=framed, scaling=constrained);
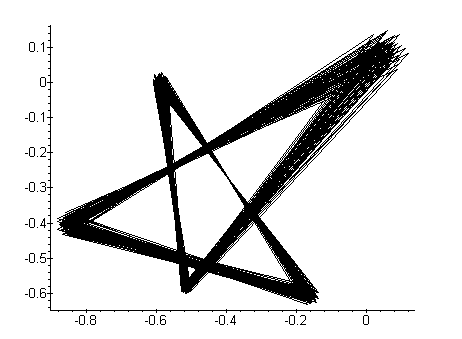
> plot(orbits(-0.50977517291904, -0.60039090737700, 300), style=line,
>    axes=framed, scaling=constrained);
> # orbits1.gif 'Spiral'
> plot(orbits(-0.61143695190549, -0.36571035906672, 500), style=point,
>    symbol=POINT, axes=framed, scaling=constrained);

> # orbits3.gif 'Vortex'
> plot(orbits(-0.34555229917169, -0.60430224984884, 300), style=point,
>    symbol=POINT, axes=framed, scaling=constrained);

> # orbits4.gif
> plot(orbits(+0.24877810105681, +0.58083451911807, 115), style=line,
>    axes=framed, scaling=constrained);

> # orbits5.gif 'Radiation'
> plot(orbits(-0.33382209390402, -0.60821359232068, 500), style=point,
>    symbol=POINT, axes=framed, scaling=constrained);

> # orbits6.gif
> plot(orbits(-0.25953079387546, -0.62385896220803, 500), style=point,
>    symbol=POINT, axes=framed, scaling=constrained);

> plot(orbits(-0.14222874119878, -0.64732701703906, 300), style=line,
>    axes=framed, scaling=constrained);
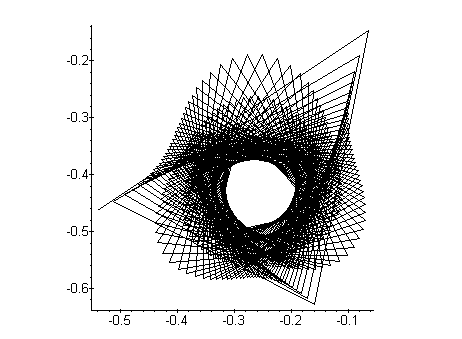
Points at the vicinity of the fractal coastline of the Mandelbrot set result in the most interesting orbits.
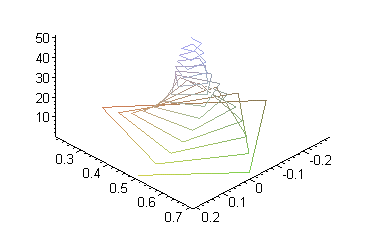
Another version of the above procedure computes the orbits of a point in three dimensions, where the third dimension (height) depicts the repective of iteration.
> restart:

> orbits3d := proc(x, y, iter)
>    local c, z, pts, i;
>    pts := NULL;
>    c := evalf(x+y*I);
>    z := c;
>    for i to iter do
>       if abs(z) < 1e10 then  # avoid overflow
>          pts := pts, [Re(z), Im(z), i]
>       fi;
>       z := z^2+c
>    od;
>    [pts]
> end:

> plots[spacecurve](orbits3d(0.2, 0.5, 50),
>    x=-2 .. 2, y=-2 .. 2, style=line, axes=framed, orientation=[45, 45]);
MAPLE V FRACTALS MandelbrotOrbits #1.1 current as of May 22, 1999
Author: Alexander F. Walz, alexander.f.walz@t-online.de
Original file location: http://www.math.utsa.edu/mirrors/maple/mfrorbit.htm